An engine bearing begins to degrade long before an alarm sounds. The first sign is often a small change in vibration: a new spectral peak, a slight phase shift, or a slow increase in broadband noise. If the data acquisition system cannot preserve those details, the problem can go unnoticed until the machine fails. Vibration data acquisition is therefore not simply about connecting an accelerometer to a computer. It is about building a measurement chain that captures the right frequency range, dynamic range, and time synchronization for a specific test or monitoring objective.
What Vibration Data Acquisition Systems Do
A vibration data acquisition system performs four tasks: it senses mechanical motion, conditions the electrical signal, converts it to a digital record, and then analyzes or stores the result. Each stage has limits, and the weakest link determines the overall measurement quality.
The sensor is usually an accelerometer, force transducer, or microphone. The signal conditioner applies gain, filtering, and, in the case of IEPE sensors, constant current excitation. The analog-to-digital converter samples the conditioned signal at a defined rate and resolution. Finally, software packages turn digital time histories into FFT spectra, orbits, order tracks, or modal parameters. A well-designed system keeps all these elements balanced.
Start with the Accelerometer, Not the Computer
Choosing the sensor first may feel counterintuitive, but the accelerometer defines the frequency band and dynamic range available to the entire chain. Piezoelectric accelerometers cover most industrial vibration measurements, while force sensors and microphones handle specific applications. The main question is the output type, because it determines how the data acquisition front end must be configured.
Table 1. Common accelerometer output formats for vibration data acquisition.
| Output type |
Power needed |
Typical use |
Key consideration |
| Charge |
None (charge amplifier) |
High-temperature, machinery vibration |
Cable noise and charge amplifier required |
| IEPE |
Constant current 2–20 mA |
General vibration, modal, condition monitoring |
Built-in electronics, easy to interface |
| Voltage |
External supply |
Research and custom setups |
Needs stable supply and careful grounding |
For a rotating machinery survey, an IEPE accelerometer with a sensitivity of 100 mV/g is a common starting point because it provides a useful frequency range of roughly 0.5 Hz to 10 kHz. When temperatures exceed the operating range of built-in electronics, charge-mode accelerometers are safer. The acquisition system must match the sensor: an IEPE input supplies constant current and decouples bias voltage, while a charge input requires a charge amplifier. Ignoring this match is one of the most frequent sources of faulty setup.
Sampling Rate, Anti-Aliasing, and ADC Resolution
Sampling rate determines the highest signal frequency you can capture. The Nyquist criterion requires sampling at more than twice the maximum frequency of interest; practical dynamic analyzers use a 2.56 times ratio to leave room for anti-aliasing filter roll-off. For a 10 kHz analysis range, that means a 25.6 kHz sample rate or higher.
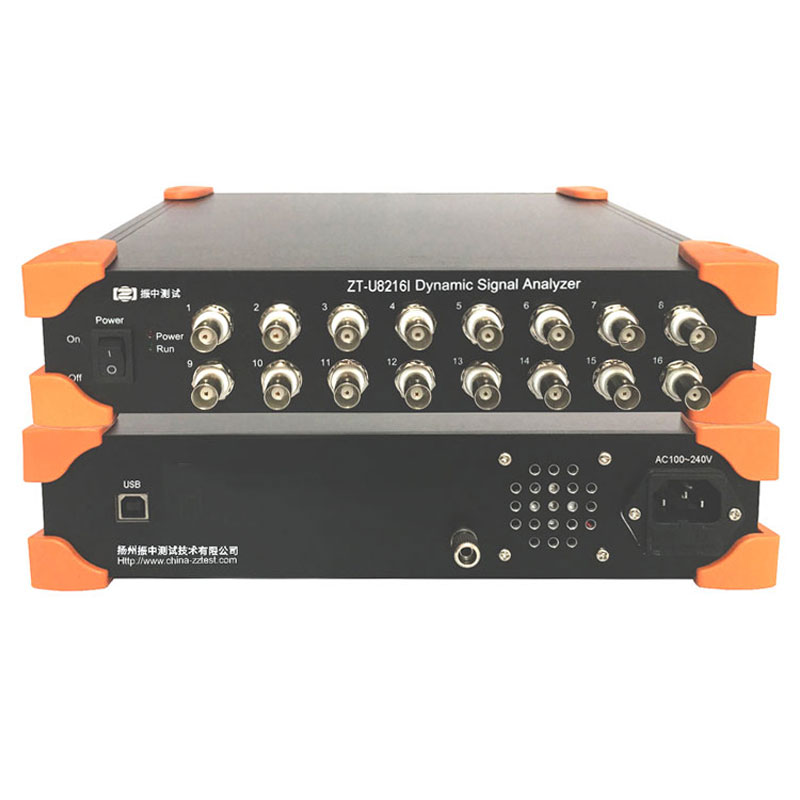
Machinery vibration is often analyzed up to 20 kHz; bearing fault diagnosis may need 40 to 80 kHz. High-frequency shock tests and ultrasonic measurements require even more. On the resolution side, 24-bit converters provide a wide dynamic range, but the effective number of bits, input noise, and channel phase matching matter more than the marketing specification. A unit such as the ZTU8508C offers 1 MHz sampling capacity for capturing transients and high-frequency resonances that ordinary analyzers miss.
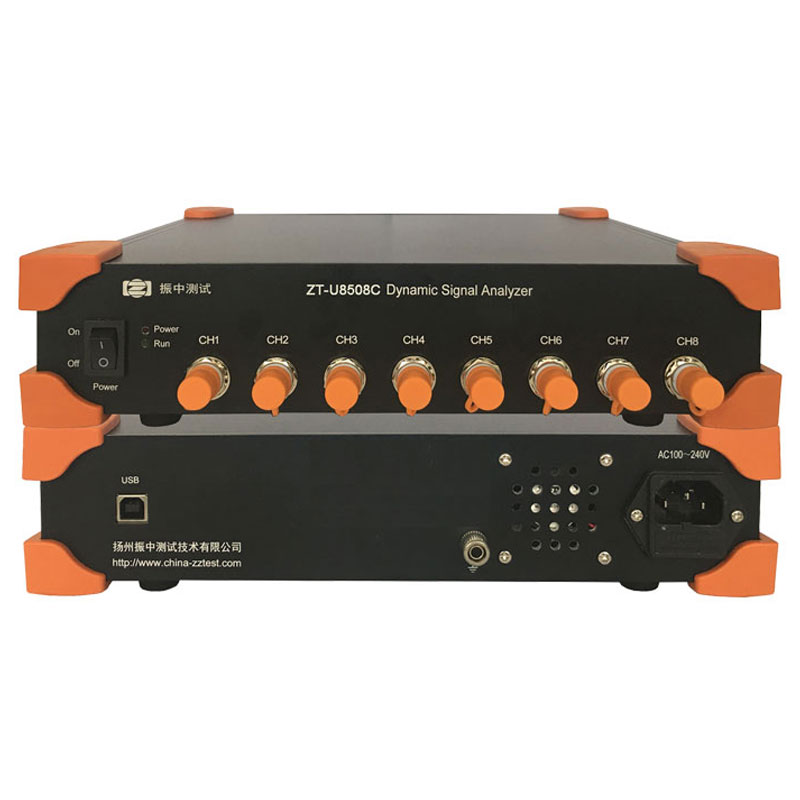 ZT-U8508C 8-Channel Dynamic Signal Analyzer with 1 MHz SamplingThis 8-channel analyzer samples at up to 1 MHz per channel with hardware-synchronized clocks, ensuring matched phase response for high-frequency transient capture and multi-channel frequency domain analysis.View Product →
Channel Count, Interface Options, and Synchronization
Many projects require more than one channel. Three-axis vibration measurement uses at least four inputs including a tachometer. Experimental modal analysis can use dozens of simultaneous channels. When channels must be compared in the frequency domain, all inputs need to sample simultaneously with tightly matched phase response. Small phase mismatches between channels will distort frequency response function estimates and operational deflection shapes.
Interface choices affect how easily you can scale the system. USB devices suit benchtop and portable work, network devices allow longer cable runs and distributed layouts, and plugin or embedded systems handle large channel counts. The table below summarizes typical trade-offs.
Table 2. Interface types for vibration data acquisition instruments.
| Interface |
Typical channels |
Best suited for |
Notes |
| USB 2.0 |
1 to 32 |
Portable, benchtop tests |
Plug-and-play, limited cable length |
| 100 Mbps Ethernet |
8 to 16 |
Distributed sensors, permanent installations |
Reliable transmission over longer distances |
| Gigabit Ethernet |
4 to 32 |
Higher channel density, faster streaming |
Better for continuous monitoring |
| Plugin or embedded |
32+ |
Large modal systems, custom integration |
High channel density, may need host controller |
For a balance between channel count and field installation convenience, a 16-channel network analyzer such as the ZTN8116C is a practical choice. It receives data over a 100 Mbps Ethernet link and can support distributed measurement layouts where the host computer is located far from the machine.
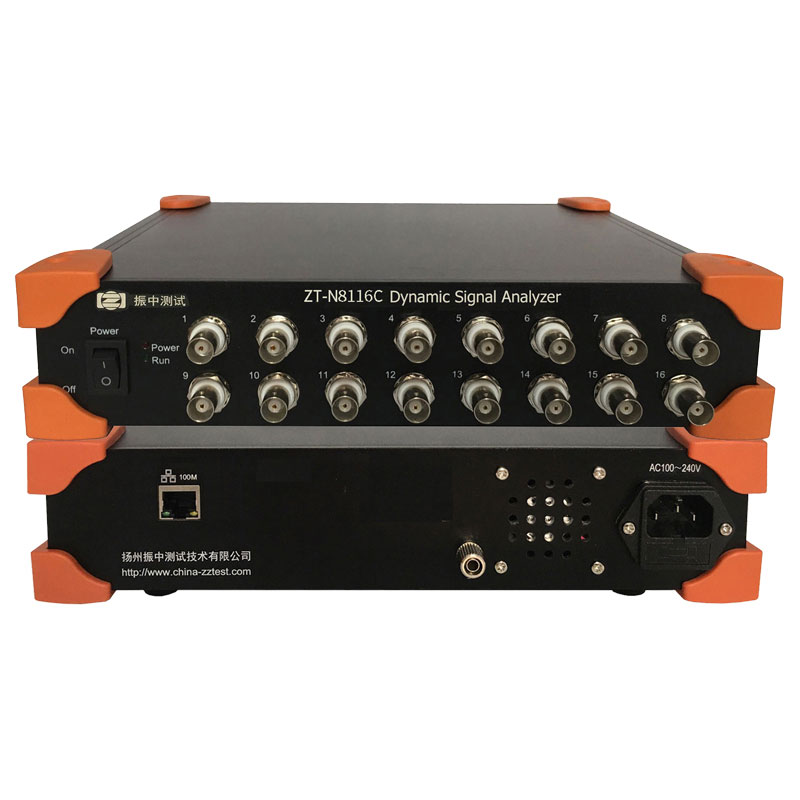 ZT-N8116C 16-Channel Dynamic Signal Analyzer with EthernetA 16-channel parallel acquisition system supporting voltage, IEPE, and charge inputs, offering 64 kS/s sampling across all channels and Ethernet connectivity for distributed field measurement layouts.View Product →
Portable Analyzers vs. Lab-Grade Systems
Portable analyzers trade a little channel count for ease of carrying. They are used for field balancing, on-site machine checks, and pass/fail measurements after maintenance. A compact USB unit with real-time spectrum display allows technicians to see a vibration peak change while adjusting a rotor or tightening a foundation. This immediacy is often more valuable than having more channels.
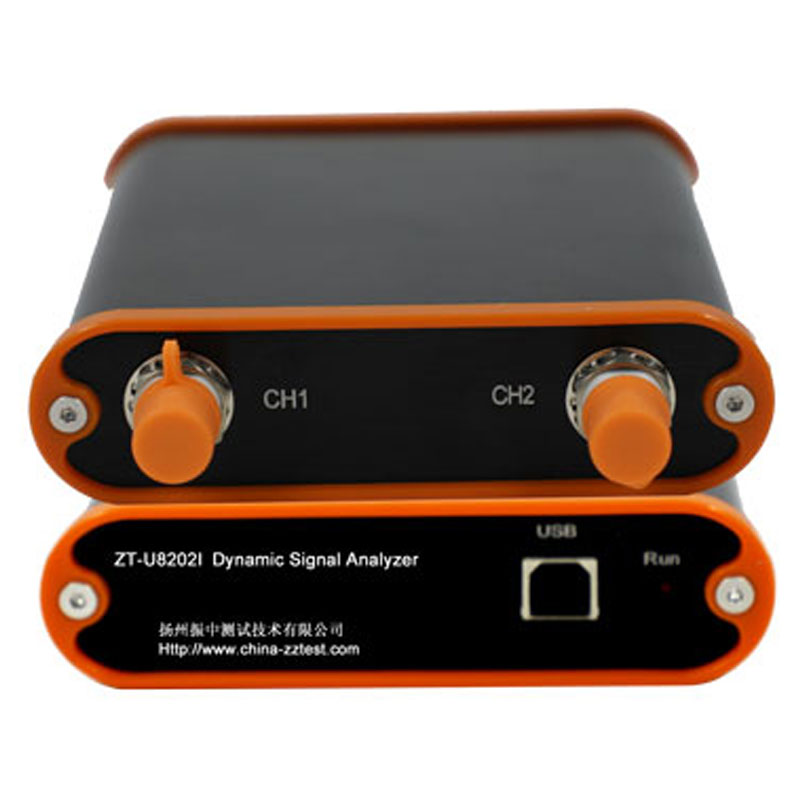
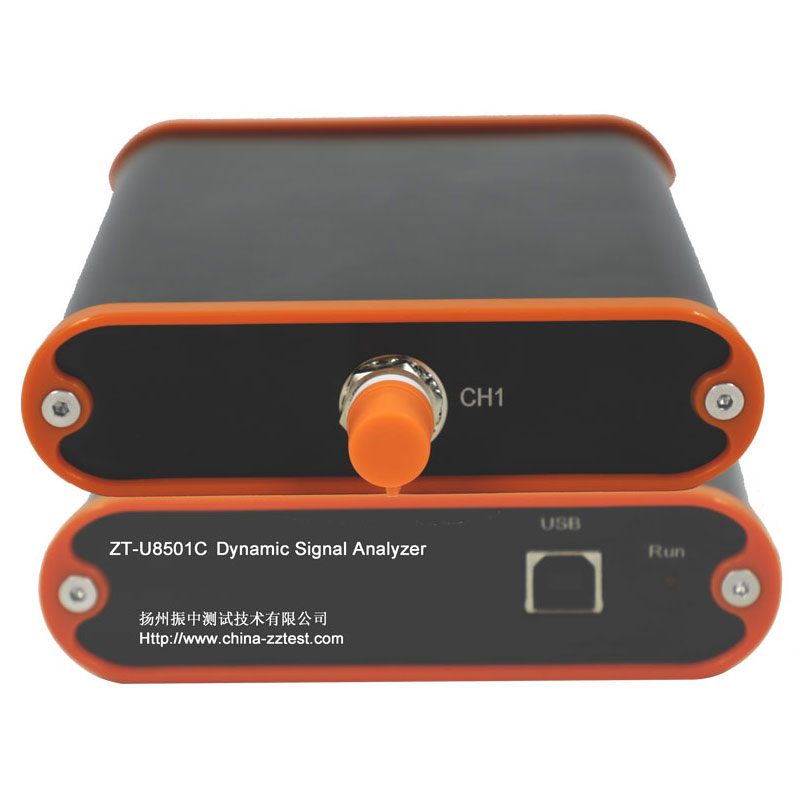
A portable analyzer such as the ZTU8201I provides real-time spectrum processing in a small enclosure, which simplifies troubleshooting on the plant floor. When the task grows into a 32-channel modal test, you can move to a synchronized network system.
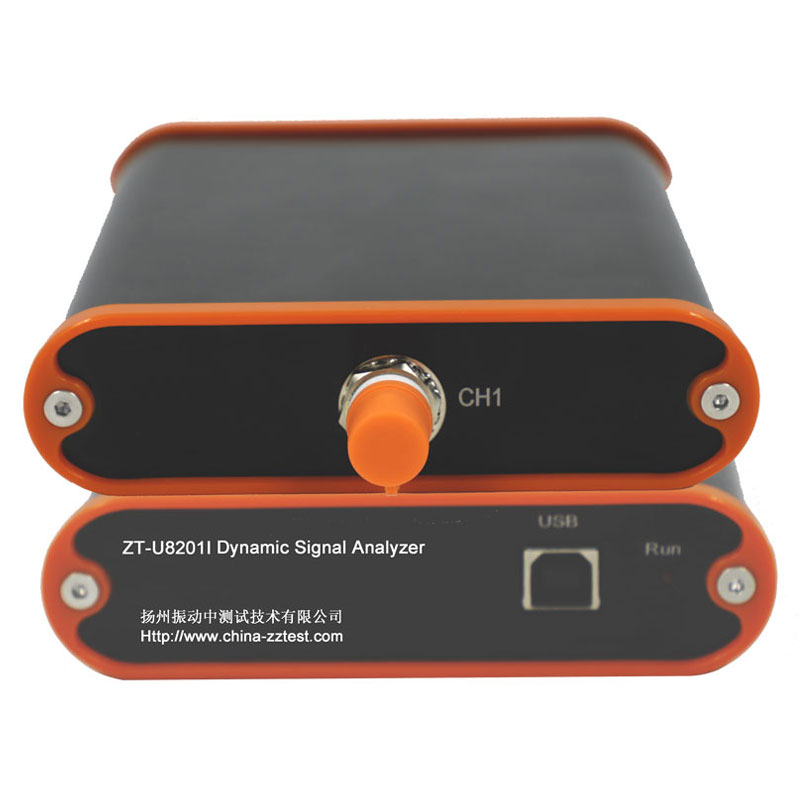 ZT-U8201I Compact USB Real-Time Spectrum AnalyzerA lightweight, portable USB analyzer with real-time spectrum processing, suitable for on-site vibration troubleshooting, acoustic analysis, and fault diagnosis when paired with PC software.View Product →
From Raw Time Waveform to Engineering Insight
Acquisition is only half of the task. The software layer converts time waveforms into information: frequency spectra, order maps, mode shapes, and trend curves. Analysis settings such as windowing, overlap, averaging, and FFT lines directly affect the result. Understanding how a dynamic signal analyzer differs from a traditional data logger can help avoid incorrect specifications. If you capture a perfect signal but cannot visualize low-frequency harmonics or cross-power spectra in the right way, the system is not performing its intended job.
Matching the Acquisition Strategy to the Application
Modal testing requires a shaker or impact hammer to excite the structure, synchronized multi-channel acquisition, and low channel-to-channel phase error. Rotating machine monitoring emphasizes continuous sampling, tachometer inputs, and order tracking. Acoustic measurements need low-noise microphones and proper IEPE power. A flexible front end that accepts voltage, IEPE, and charge inputs will cover most scenarios.
For projects that combine sensors, acquisition, excitation, and analysis software into one turnkey arrangement, working with a single supplier can simplify integration; a structured vibration and dynamic testing system often reduces procurement risk and training time.
Practical Purchasing Considerations
Before purchase, examine the channel-to-channel phase specification, not just the ADC bit depth. Look for built-in anti-aliasing filters and calibration traceability. Ask whether the software can export data to common formats and whether the vendor provides training or support. If the measurement chain includes accelerometers from one source and a data recorder from another, verify bias voltages, cable capacitance, and connector types. Field connectors and cable quality are common weak points in vibration data acquisition, especially in high-noise environments.
Build the Chain Before You Buy
Choose the sensor for your frequency and amplitude range, select an acquisition front end that matches the sensor and provides the required channel count and synchronization, then choose software that answers your engineering question. The result is a system that works on the first day and keeps working across many projects.

 English



















 Address : No. 85, Hetao West Road, Hanjiang District, Yangzhou City, Jiangsu Province, China
  Phone: +86-0514-85764839
  Tel: +86-0514-85764839
  Email: sales@china-zztest.com