Shopping for a sound pressure level meter is a strange experience. A dozen instruments look almost identical, sit within a narrow price band, and all promise "high accuracy". The differences that actually decide whether your data survives scrutiny are rarely visible in a product photo. They live in the microphone capsule, in the tolerance class the instrument was approved to, in the frequency range it can honestly cover, and in the information it hands back to you once the measurement is over.
We spend our working days building noise and vibration measurement chains, so our view is a practical one: there is no single best sound pressure level meter, only the best match between an instrument and a job. This guide walks through what these instruments really measure, how the Class 1 and Class 2 distinction works, when a handheld meter stops being enough, and which specifications deserve your attention before you commit.
What a Sound Pressure Level Meter Actually Measures
Sound is a fast, tiny fluctuation in air pressure. The background of a quiet office moves the air by a fraction of a pascal, normal conversation by a few hundredths of a pascal, and a jet engine at close range by tens of pascals. Because that span covers several million to one, it is compressed onto a logarithmic scale, the decibel, with a reference pressure of 20 micropascals (µPa) — roughly the quietest 1 kHz tone a young, healthy ear can detect.
Whatever the price tag, every sound pressure level meter contains the same four blocks. A microphone capsule converts pressure into a very small voltage. A preamplifier buffers that voltage and drives a cable without adding noise. Conversion and processing electronics apply frequency weighting and time weighting to the signal. A display, memory card, or network link carries the result out of the instrument. What changes between an inexpensive meter and a laboratory chain is not the architecture but how faithfully each block performs, and how much of the original signal you are allowed to keep.
A meter that shows only one number is hiding a great many decisions that were made on your behalf. Before comparing models, it helps to be fluent in the vocabulary on the specification sheet:
- SPL (dB re 20 µPa): the instantaneous sound pressure level, the number people mean when they ask how loud something is.
- A-weighting: a filter that attenuates low frequencies in a way that mimics human hearing; it is the basis of almost every environmental and workplace noise limit.
- C-weighting and Z (flat): heavier low-frequency content and no weighting at all, used for peak levels, equipment tests, and any analysis where you do not want the instrument's opinion baked into the data.
- Time weighting: the Fast, Slow, and Impulse response curves that govern how quickly the displayed level follows a changing signal.
- Leq: the equivalent continuous level, an energy average over a stated period, and a far better summary of a fluctuating source than any single instant.
- Lmax, Lmin, and Lpeak: the extremes, with peak measured on a much faster detector than the display can follow.
- Octave and third-octave bands: the level split by frequency, which is what you need in order to identify a tonal source or compare a result with a noise rating curve.
- Statistical levels (L10, L50, L90): the levels exceeded for 10, 50, and 90 percent of a measurement period, widely used in traffic and community noise assessment.
An instrument that reports only the first item on that list is a screening tool. An instrument that reports all of them, with enough memory and battery life to keep running for days, is a monitoring instrument. Deciding which of the two you actually need is the first honest purchasing decision.
Matching the Instrument to the Job
The same measurement principle serves very different tasks, and the tasks impose different demands on the hardware. Most buying mistakes come from choosing an instrument that is excellent at one job and inadequate for the job actually at hand.
Environmental and community noise
Measurements run for hours or days, outdoors, in weather. What matters is long-term logging, statistical levels, a weatherproof housing, and a stable power supply. A short walk-through with a handheld meter cannot answer a question about night-time traffic exposure.
Workplace and occupational noise
Hearing conservation programmes need personal exposure figures, an energy-averaged level normalised to an eight-hour day, and reliable peak capture for impulsive sources. Repeatability between operators matters as much as absolute accuracy.
Product and machinery noise
Here the goal is rarely a single dBA figure. Engineers compare prototypes, track a tone against shaft speed, and localise a source on a running machine. That work needs spectra, time waveforms, and often simultaneous vibration channels.
Building and room acoustics
Insulation testing, reverberation time, and background noise from ventilation systems all require band data, controlled source levels, and corrections for the measurement environment rather than a bare A-weighted number.
Research and education
Teaching laboratories and research groups usually want raw data they can re-analyse, export, and compare across experiments, plus a calibration route that keeps student measurements traceable semester after semester.
Accuracy Classes: Class 1, Class 2, and the Laboratory Chain
IEC 61672-1 defines two performance classes for sound level meters. A Class 1 instrument must hold tighter tolerances over a wider frequency range than a Class 2 instrument, and both classes are verified through type approval and, in many countries, periodic verification of the individual instrument. Class 1 is normally expected wherever a result may be contested — compliance reporting, legal disputes, product declarations — while Class 2 suits general surveys, screening, and internal checks.
The class label, however, describes the meter. It says nothing about how well you have used it, how the microphone was mounted, or whether the measurement chain was verified on the day. A Class 1 meter aimed at the wrong spot, without a windscreen in a light breeze, will produce worse data than a Class 2 meter used carefully.
The third route — a measurement microphone feeding a dynamic signal analyzer — sits outside the handheld class system altogether. Its accuracy is a property of the whole chain: capsule, preamplifier, cabling, digitiser, and calibration. That gives you freedom, but it also means the responsibility for traceability is yours.
A simplified comparison of the three routes most buyers choose between; exact figures depend on the individual instrument, its approval certificate, and how the chain is calibrated.
| Aspect |
Class 2 handheld |
Class 1 handheld |
Measurement microphone with analyzer |
| Typical frequency range |
20 Hz to 8 kHz |
10 Hz to 20 kHz |
3 Hz to 20 kHz and beyond |
| Tolerance at verification |
Wider limits |
Tighter limits |
Set by the capsule and the calibration chain |
| Frequency weighting |
A, C, Z |
A, C, Z |
Any weighting computed later from stored data |
| Time weighting |
Fast, Slow, Impulse |
Fast, Slow, Impulse |
Configurable in software |
| Data retained |
Summary levels |
Summary levels plus logging |
Raw waveforms, spectra, and band data |
| Best suited to |
Walk-through checks and screening |
Compliance and formal reporting |
Research, NVH, source location, long-term monitoring |
The Microphone Decides More Than the Meter Does
If you take one idea away from this article, let it be this one: in most practical situations, the microphone capsule and its preamplifier limit the quality of a measurement long before the electronics do. A precision capsule with a well-matched preamplifier in front of an ordinary digitiser will outperform an excellent digitiser fed by a mediocre capsule, every time.
Measurement condenser microphones are specified by diameter for a reason. A half-inch capsule offers a good compromise between sensitivity and high-frequency behaviour, while a quarter-inch capsule sacrifices sensitivity for a wider, flatter response and better performance in high sound levels and in confined spaces. Free-field, pressure, and random-incidence versions correct for different acoustic environments; choosing the wrong one introduces a few tenths of a decibel of error at high frequencies, which matters when you are comparing results between laboratories.
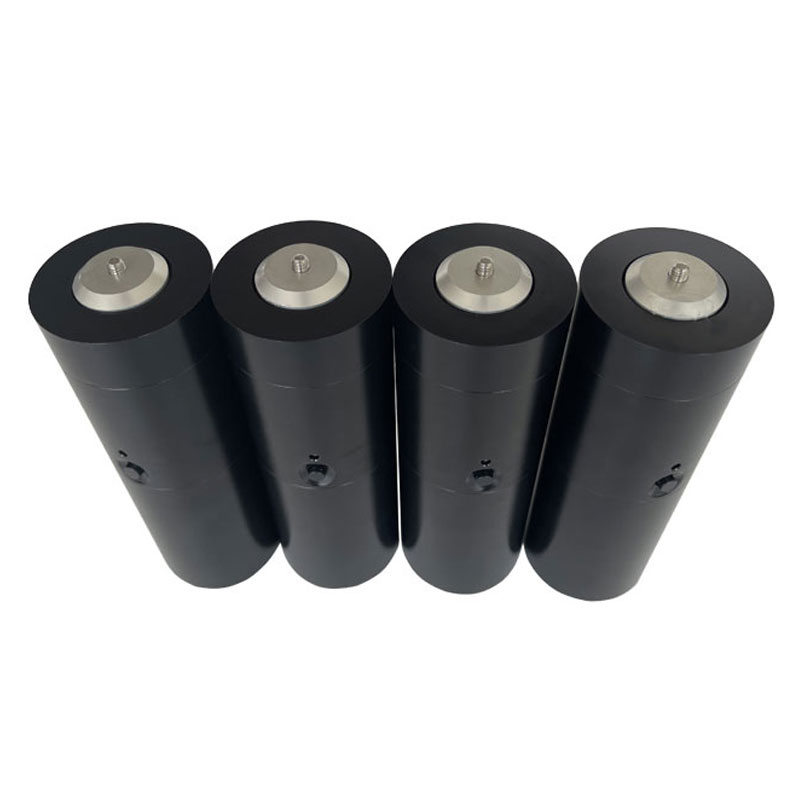
Polarisation is the other decision. Externally polarised microphones need a separate 200 V supply and deliver excellent long-term stability. Prepolarised (CCP/IEPE) types work from a simple constant-current supply, which is why they integrate so easily with modern data acquisition hardware, including our own acoustic condenser microphone range, where the capsule, preamplifier, and powering arrangement are matched so that the sensitivity you calibrate against is the sensitivity you measure with.
From Microphone to Data: What the Analyzer Adds
Handheld meters deliberately discard information. Most of them compute level against time and keep only the summary. A dynamic signal analyzer does the opposite: it stores the raw, calibrated waveform from the microphone so that every later question — band levels, spectra, tonality, impulsiveness, correlation with machine speed — can be answered from the same record without a second visit to site.
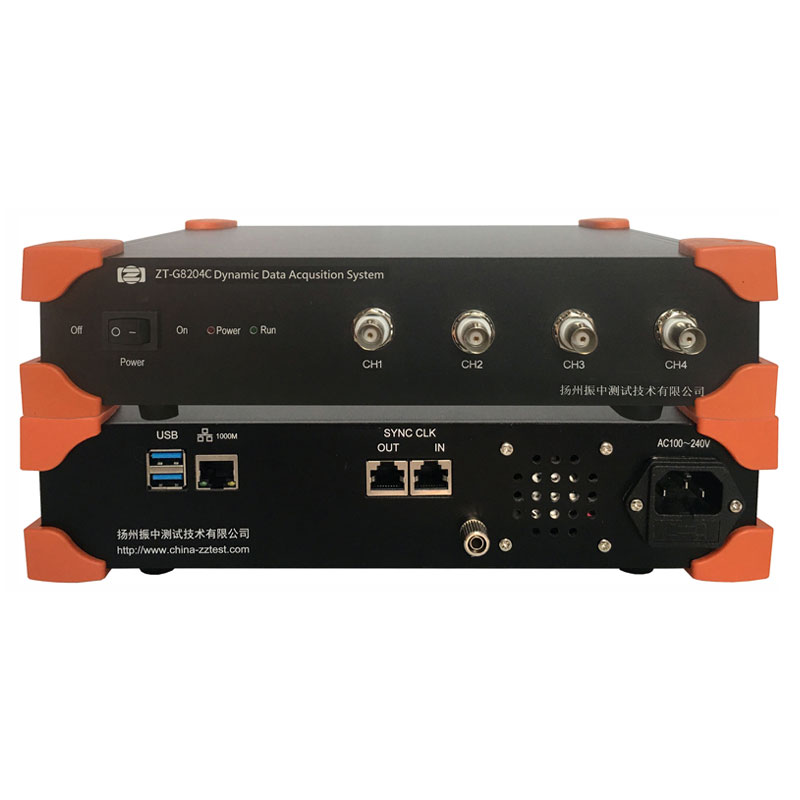
The requirements are simple to state. The analog front end must supply constant-current power to the microphone, typically a few milliamps at 18 to 24 volts. The analog-to-digital converter should be 24-bit with simultaneous sampling on all channels, so that phase relationships between microphones and accelerometers are preserved. The sampling rate must exceed twice the highest frequency of interest, and in practice you want considerably more margin than that if you intend to capture impulsive events or reuse the waveform for playback. A high-speed single-channel instrument such as the ZTU8301C, which samples at up to 256 kHz, is exactly the kind of tool that turns a microphone into a full measurement station.
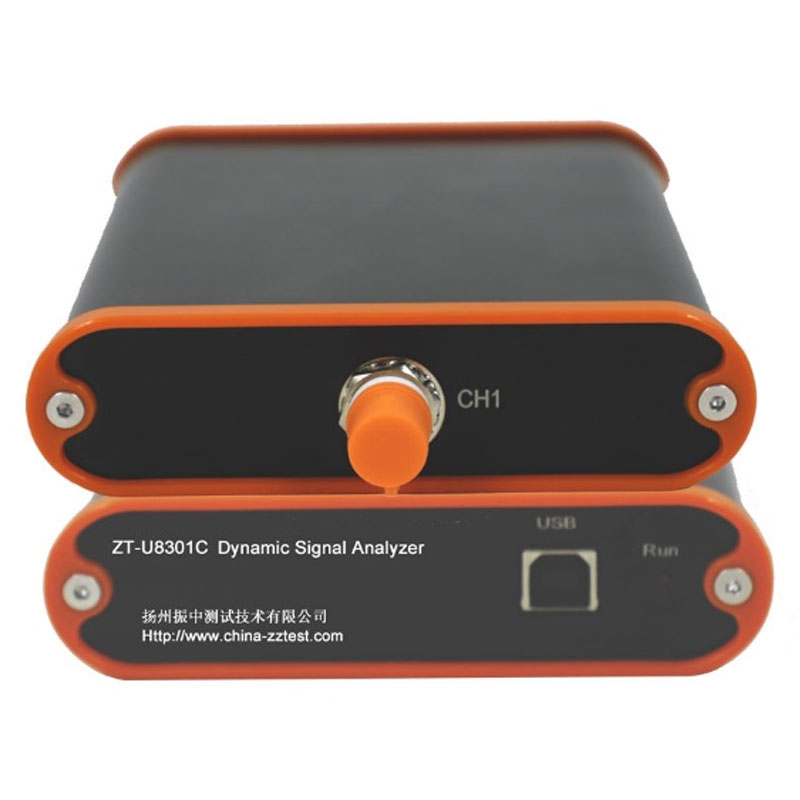 ZT-U8301C 256 kHz Single-Channel Dynamic Signal AnalyzerA USB 24-bit single-channel analyzer with 256 kHz sampling, IEPE power, and anti-aliasing filtering for turning microphones into measurement stations.View Product →
If you are not yet sure where a general-purpose instrument ends and a genuine analyzer begins, this short explanation of how a dynamic signal analyzer differs from a traditional instrument is a useful place to start.
When One Microphone Is Not Enough
Plenty of noise problems cannot be solved from a single point. Locating a source on a large machine, mapping a sound field around a vehicle, measuring pass-by noise, or monitoring several positions around a plant all depend on many channels recorded at the same instant. Channel-to-channel phase matching becomes more important than absolute accuracy, because the useful information is in the differences between channels.
That is where channel count and data throughput take over from capsule specification. A card-based analyzer such as the ZTG9232I, with 32 channels streamed over gigabit Ethernet, gives you a synchronous snapshot of an entire structure in one pass, and lets the same hardware serve both acoustic arrays and the accelerometer channels that usually accompany them.
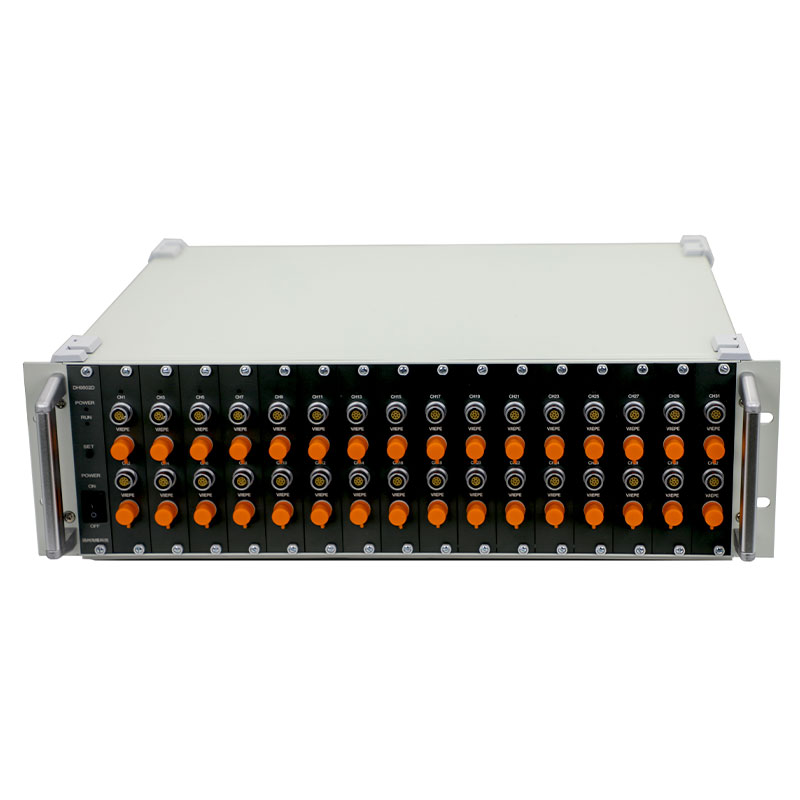 ZT-G9232I 32-Channel Gigabit Ethernet Dynamic Signal AnalyzerA 32-channel, 24-bit Ethernet analyzer for synchronous voltage, IEPE, and strain acquisition in multi-point vibration and noise monitoring.View Product →
For multi-point work, budget for the cabling and the recording time as carefully as you budget for channels. A 32-channel record at a high sampling rate fills storage surprisingly quickly, and the ability to trigger, pre-trigger, and segment recordings often matters more than raw bandwidth.
Calibration, Traceability, and Field Checks
Every acoustic measurement chain drifts, and every result that matters should be defended. The routine is straightforward: apply an acoustic calibrator to the microphone immediately before the measurement and again immediately afterwards. If the two checks agree within a small margin, the chain is considered stable for the duration. If they disagree, the data between them is suspect, regardless of how elegant the spectrum looks.
Field calibrators typically produce 94 dB and 114 dB at 1 kHz on the mounted microphone, with a Class 1 calibrator specified under IEC 60942 being the appropriate companion for a Class 1 measurement chain. In addition to daily checks, the instrument and the microphone should go back to a laboratory at defined intervals for verification, so that the traceability of your results does not depend on a device that has quietly drifted for three years.
- Environment corrections. Temperature, humidity, and static pressure all influence capsule sensitivity, and the largest effects appear at the extremes of the operating range rather than in a comfortable laboratory.
- Windscreen. Outdoors, a windscreen is essential; its insertion effect is small but not zero, and it should be accounted for when results are reported to a fraction of a decibel.
- Background noise. When the source of interest is only a few decibels above the background, the measured level is partly the background. Standard practice is to apply a correction when the difference is small and to discard the measurement when the source barely exceeds the background at all.
- Mounting and orientation. Reflections from the operator, from a tripod, or from the ground plane can exceed the accuracy class of the instrument itself.
Handheld Meter or Measurement Chain? A Decision Path
The choice usually resolves itself once you answer three questions honestly. Do you need to defend the number in a formal context? Do you need to understand the source, rather than merely quantify it? Will anyone ask a new question about this data six months from now?
- Two or three answers of "no" point to a Class 2 handheld meter, used carefully, checked with a calibrator.
- A "yes" on formal defensibility points to a Class 1 instrument with logging and a documented verification history.
- A "yes" on understanding the source, or on future re-analysis, points to a microphone and analyzer chain where the raw signal is preserved.
Many teams end up with both: a handheld meter for rapid surveys and a channel-based system for the measurements that generate reports. If your work spans noise and vibration together, it is worth reviewing how the two sides fit into a single architecture, which is what our vibration and dynamic testing systems are built around — shared sensors, shared acquisition, and a common analysis environment.
Specifications to Check Before You Buy
The following list is the one we would apply to any candidate instrument, whatever the brand or the price bracket. Work through it in order and most unsuitable models will eliminate themselves.
- Microphone type and diameter. Confirm whether the capsule is free-field, pressure, or random-incidence, and whether it is prepolarised or externally polarised.
- Frequency range. Check the range over which the stated tolerance actually applies, not the range at which the instrument merely produces a number.
- Dynamic range and self-noise. A wide range is only useful if the bottom end is genuinely quiet enough for your lowest expected level.
- Weighting and time constants. A, C, and Z weighting plus Fast, Slow, and Impulse cover the vast majority of standards-based work.
- Data logging and memory. Determine how many days of unattended recording the instrument can hold, and how the data is retrieved.
- Sampling rate and bit depth. For analysis work, look for 24-bit conversion and simultaneous sampling across all channels.
- Input type and sensor power. Voltage, IEPE, and charge inputs, with adequate constant-current supply for long cables, keep your options open.
- Channel count. Buy for the largest measurement you realistically expect, not the smallest one you can imagine.
- Interface and synchronisation. USB for portable single-unit work; Ethernet for permanent installations and multi-unit synchronisation.
- Software and export. Check that results can be exported in formats your reporting workflow already uses, without a proprietary converter.
- Calibration path. Confirm that the capsule can be calibrated with a standard field calibrator and verified in a laboratory.
- Environmental protection. Outdoor and industrial use demands connectors, housings, and cabling rated for the conditions they will meet.
Typical dynamic range span for each route (approximate, in decibels)
Class 2 handheld meter — around 80 dB
Class 1 handheld meter — around 110 dB
Measurement microphone with 24-bit analyzer — around 130 dB
Manufacturers quote ranges on different bases — A-weighted, Z-weighted, single range or split ranges — so treat these bars as orientation only and always compare datasheets on the same basis.
Where Sound Pressure Measurements Go Wrong
After enough site visits, the same handful of errors appears again and again, and none of them is caused by the instrument being the wrong class.
- Measuring in a breeze without a windscreen, then wondering why the low-frequency level is inflated.
- Standing between the source and the microphone, and measuring the reflection rather than the source.
- Recording a level only a couple of decibels above the background and reporting it as if it were the source alone.
- Using A-weighted data to investigate a low-frequency problem that A-weighting was designed to de-emphasise.
- Forgetting that a single Leq value cannot describe an impulsive source, and omitting peak measurements entirely.
- Calibrating at the start of a survey and not at the end, so that nothing verifies the chain during the hours in between.
- Recording only summary levels, then discovering later that the interesting question needed the waveform.
Notice how many of these problems are solved not by spending more money but by deciding in advance what the data must answer. A short written measurement plan, one page long, prevents most of them.
Bringing Noise and Vibration Together
In practice, sound pressure rarely arrives alone. A machine that is loud is usually also vibrating, and the two measurements answer different halves of the same question. Microphones capture what the operator hears; accelerometers and force sensors reveal where the energy comes from, and how it travels through the structure before it radiates as noise.
Because the acquisition hardware is shared, the marginal cost of adding vibration channels to a noise measurement is small. The same analyzer records microphone, accelerometer, and force channels simultaneously, so that order tracking, modal analysis, and transfer path studies all run on data captured in a single session. Where the acoustic measurement needs a calibration certificate, the vibration channels need their own calibration route, and both benefit from being verified together before the machine starts running.
Frequently Asked Questions
Is a Class 1 meter always the better choice?
Not automatically. Class 1 buys you tighter tolerances and a wider verified frequency range, which is essential when a result must be defended formally. For routine screening and internal comparisons, a carefully used Class 2 instrument produces perfectly serviceable numbers. What makes either class trustworthy is calibration discipline and sensible measurement practice.
Can a smartphone application replace a sound pressure level meter?
A phone microphone is designed for speech, not for metrology. Its frequency response is uneven, its automatic gain control may be active, and its absolute sensitivity is not traceable. Phone applications are useful for a rough indication of whether a space is loud, and for nothing that needs to be written down in a report.
How often should the chain be calibrated?
Field checks before and after every measurement session, without exception. Laboratory verification of the instrument and capsule at intervals defined by your quality system or by the regulation you work under. If a field check falls outside its acceptance margin, treat the whole session as suspect.
Do I really need octave band data?
If you need to know what the noise is, rather than merely how loud it is, then yes. A single A-weighted level says nothing about whether a problem is tonal, low-frequency, or broadband, and the mitigation strategy is completely different in each case. Band data is also what most noise rating schemes are written around.
How much should a good sound pressure level meter cost?
Prices track capability rather than brand. A screening meter, a Class 1 logging instrument, and a multi-channel analysis chain sit in three clearly separated budget brackets, and the deciding factor should be which bracket matches the questions you need to answer. Buying one class above your need is affordable; buying one class below it usually means repeating the work.
Looking for the best sound pressure level meter is really a question about measurement intent. Decide what the data has to prove, how long it has to survive, and who might re-examine it, and the specification sheet becomes much easier to read. Choose the capsule first, the conversion electronics second, and the enclosure last — then calibrate the whole chain before you trust a single number it produces. That order of thinking has served us well across bridges, machine halls, laboratories, and construction sites, and it will serve you well too.

 English




















 Address : No. 85, Hetao West Road, Hanjiang District, Yangzhou City, Jiangsu Province, China
 Phone: +86-0514-85764839
 Tel: +86-0514-85764839
 Email: sales@china-zztest.com
