Stand on a bridge deck at six in the morning, or beside a compressor that everyone on the shop floor swears is perfectly normal, and sooner or later you reach the same conclusion: an impression is not a measurement. A sound level meter exists to make that conversion. Acoustic pressure in pascals becomes a number in decibels, and that number can be compared with a limit, a baseline, or a reading someone else took in the same place two years ago.
We build the measuring chain that sits behind those numbers every day: condenser microphones, multi-channel dynamic signal analyzers, excitation equipment and calibration instruments. The same questions keep arriving from test engineers, maintenance teams and university laboratories, so this guide gathers the practical answers in one place: what the instrument actually measures, how the standards classify it, where readings usually go wrong, and when a handheld meter should give way to a full acquisition system.
What a Sound Level Meter Really Measures
Inside the instrument, a microphone diaphragm moves by a few nanometres and produces a voltage proportional to sound pressure. That pressure is then expressed relative to a reference of 20 micropascals, roughly the threshold of hearing at 1 kHz, using a logarithmic ratio: 20 times the base-10 logarithm of measured pressure divided by reference pressure. The decibel scale exists because the ear itself is logarithmic. A six-decibel rise doubles the sound pressure, a ten-decibel rise is usually heard as roughly twice as loud, and a hundredfold pressure increase becomes a manageable forty decibels.
Note what is being measured. A sound level meter reports sound pressure level at the position of its capsule. It does not report sound power, which describes the source itself and is obtained by quite different methods. Keeping that distinction clear prevents a great deal of confusion when a supplier's data sheet and a site survey appear to disagree.
Modern meters rarely stop at an instantaneous level. The detector averages the weighted signal, and the instrument stores a family of results. The table below lists the ones that appear most often in reports and standards.
Table 1. The readings most frequently quoted from a sound level meter, and the question each one answers.
| Reading |
Symbol |
What it tells you |
| Equivalent continuous level |
LAeq,T |
Energy average over period T; the basis of most occupational and environmental limits |
| Sound exposure level |
LAE |
The same energy normalised to one second, so events of different duration can be compared |
| Maximum and minimum |
LAFmax, LAFmin |
The highest and lowest weighted levels reached, always quoted with the time weighting |
| Peak level |
LCpeak |
The true instantaneous peak, used for impulse and hearing-damage criteria |
| Statistical percentile |
LA10, LA50, LA90 |
The level exceeded for that percentage of the measurement period, common in community noise |
Inside the Instrument: Capsule, Preamplifier, Detector
Most professional meters use a half-inch condenser capsule. A thin metalised diaphragm sits close to a back plate, and the changing capacitance between them becomes a voltage. Externally polarised capsules need a stable polarisation supply; pre-polarised designs carry a permanent charge in the diaphragm material and tolerate field conditions more easily. Capsule orientation matters too: free-field microphones are corrected for the disturbance caused by their own body when pointed at the source, pressure microphones are intended for flush mounting or couplers, and random-incidence types split the difference.
Behind the capsule, the preamplifier must present an extremely high input impedance so that the tiny capsule signal survives the cable. From there the signal passes through the frequency weighting network, the root-mean-square detector with its selectable time constants, and finally the display and logging stage. It is worth remembering where accuracy is really decided. The display contributes almost nothing to error; the capsule, its calibration and the acoustics around the instrument decide nearly everything.
Because the front end of any acoustic measurement is a sensor, we keep a close interest in capsule quality and mechanical stability. Our acoustic condenser microphones are built for laboratory and field use alongside the analyzers that record their output.
 Acoustic Condenser Microphones Product CategoryThis category page currently lists no microphone models, but places acoustic capsules alongside analyzers and vibration measurement equipment.View Product →
Frequency and Time Weighting Without the Jargon
The human ear is not equally sensitive at all frequencies, and no single weighting suits every question. Standards therefore define several curves, and a reading is meaningless unless the curve is stated along with the time constant used to smooth it.
Table 2. The three weightings you will meet most often, and when each one is appropriate.
| Weighting |
Shape |
Typical use |
| A |
Strong attenuation below 500 Hz, following the equal-loudness contour at moderate levels |
Occupational exposure, environmental limits, most regulatory criteria |
| C |
Much flatter, retaining low-frequency energy |
High-level assessment, peak measurements, checking low-frequency content |
| Z |
Flat across the band, no perceptual correction |
Signal analysis, calibration checks, engineering diagnostics |
Time weighting works in parallel. Fast uses a 125-millisecond exponential constant and behaves roughly like human loudness perception; Slow uses one second and gives a steadier reading; Impulse uses a fast rise and a slow decay for transient events. When a report says "82 dB" and nothing else, ask which weighting and which time constant were applied. The same event can easily produce values four or five decibels apart under different settings.
To keep the numbers anchored in everyday experience, the chart below compares typical A-weighted levels. It is a reference for intuition rather than a substitute for measurement.
Quiet bedroom 30 dB
Library 40 dB
Conversation 60 dB
Busy street 80 dB
Power tools 100 dB
Front row concert 110 dB
Pain threshold 120 dB
IEC 61672 Classes: Class 1 and Class 2 in Practice
International standard IEC 61672 divides instruments into two performance classes. The difference is not cosmetic: it sets how much tolerance the manufacturer is allowed at each frequency, how wide the linear operating range must be, and consequently which measurements the instrument can credibly support. The figures below are typical rather than exhaustive, so always confirm details against the current edition of the standard and your national verification rules.
Table 3. Typical differences between a Class 1 and a Class 2 sound level meter under IEC 61672.
| Aspect |
Class 1 |
Class 2 |
Practical meaning |
| Tolerance at 1 kHz |
Around plus or minus 0.7 dB |
Around plus or minus 1.0 dB |
Matters when the limit and the reading are close |
| Usable frequency range |
Typically to 20 kHz |
Typically to 8 kHz |
Class 1 covers high-frequency components and pure-tone work |
| Linear operating range |
Wide, often 20 to 140 dB |
Narrower, often 30 to 130 dB |
Affects low-level and very high-level measurements |
| Typical duty |
Compliance testing, diagnostics, research |
Surveys, screening, routine checks |
Match the class to the decision the data will support |
Two instruments of different classes can both be "correct" and still disagree by a decibel or more at the frequency extremes. If a contract cites a class, treat the citation as a requirement, not a preference.
Five Questions to Answer Before You Compare Models
Price lists rarely answer the questions that decide whether a purchase works out. We usually start a conversation with these:
- What decision will the number support? A one-off screening and a contractual compliance test justify different instruments.
- Which metric does the limit actually specify? The weighting, time constant and averaging period should all be written down before the first measurement.
- Single point or a map? If you need several locations simultaneously, or noise alongside vibration, a single handheld meter will eventually become the bottleneck.
- How long unattended? Logging duration, memory, battery life, weather protection and remote access all matter once a measurement runs for weeks.
- Who verifies it, and how often? Calibration and periodic verification should be planned at purchase, not discovered at the first audit.
Calibration Is the Habit That Separates Data from Numbers
An acoustic calibrator fits over the capsule and produces a known level, usually 94 dB at 1 kHz, with 114 dB available to check linearity at higher levels. The routine is short and it is not optional: check before the measurement, check after, and record both values in the file. A drift of more than half a decibel is a prompt to stop and investigate rather than to apply a correction and carry on.
Environment deserves equal attention. Wind blowing across the capsule generates its own noise, which a foam windscreen reduces but never eliminates. Temperature, humidity, atmospheric pressure and the fit of the calibrator all shift readings slightly. When comparing two surveys months apart, note these conditions as carefully as you note the instrument model.
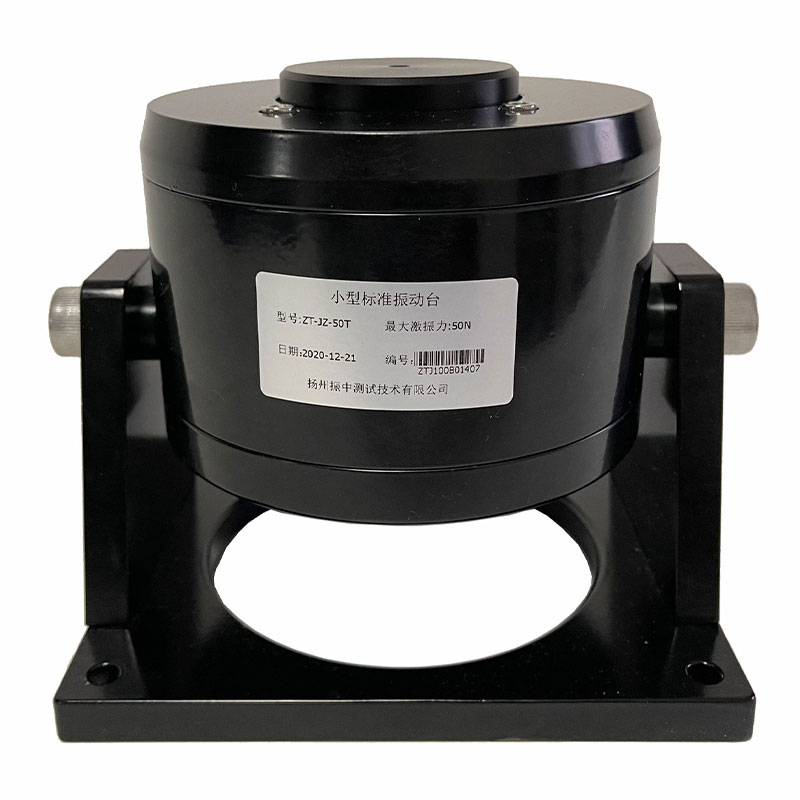
The same discipline applies on the vibration side of a test programme, where accelerometers and charge amplifiers need the same kind of field verification. Our portable vibration calibrator covers that part of the chain, so a combined noise and vibration survey can be verified from one kit bag.
Portable Vibration Calibrator for Field VerificationThe category lists five portable vibration calibrators, supporting field verification of accelerometer and charge-amplifier chains in combined noise and vibration surveys.View Product →
Where Sound Level Meters Earn Their Keep
The instrument is general purpose; the applications are specific, and each one imposes its own habits:
- Environmental and community noise. Long-term logging at boundaries, percentile statistics, and careful documentation of weather and operating conditions.
- Building acoustics. Airborne and impact insulation, reverberation time, and the octave-band data that most rating methods require.
- Machinery and product noise. Identifying dominant sources, comparing design variants, and supporting declaration or acceptance tests.
- Workplace exposure. Personal dosimetry and area surveys, with attention to duration, peak events and the actual exposure pattern.
- Transport. Pass-by measurements, vehicle interior comfort, rail and marine noise, where vibration usually has to be recorded at the same time.
- Teaching and research. Laboratory exercises and student projects, where a robust instrument with clear settings teaches better habits than an app.
If a project spans several of these areas, it is usually more economical to plan the whole chain at once rather than to buy separate instruments for each. Our vibration and dynamic testing solutions are organised around that idea: sensors, acquisition, excitation, calibration and software designed to work as one system.
Field Habits That Protect the Reading
Most bad acoustic data is not caused by bad instruments. It is caused by small procedural choices made under time pressure. These are the ones we see most often:
- Hold the meter at arm's length or mount it on a tripod; your body reflects sound and your hand can mask the capsule.
- Point a free-field capsule toward the source and keep the angle consistent between measurement points.
- Note the weighting, time constant and averaging period for every stored result, not just the headline figure.
- Record a short audio file or a third-octave snapshot alongside the level, so an odd result can be explained later.
- Measure the background separately; a source that is only a few decibels above the background cannot be quantified simply.
- Log the instrument serial number, calibration values and firmware version in the report, every time.
When a Handheld Meter Is No Longer Enough
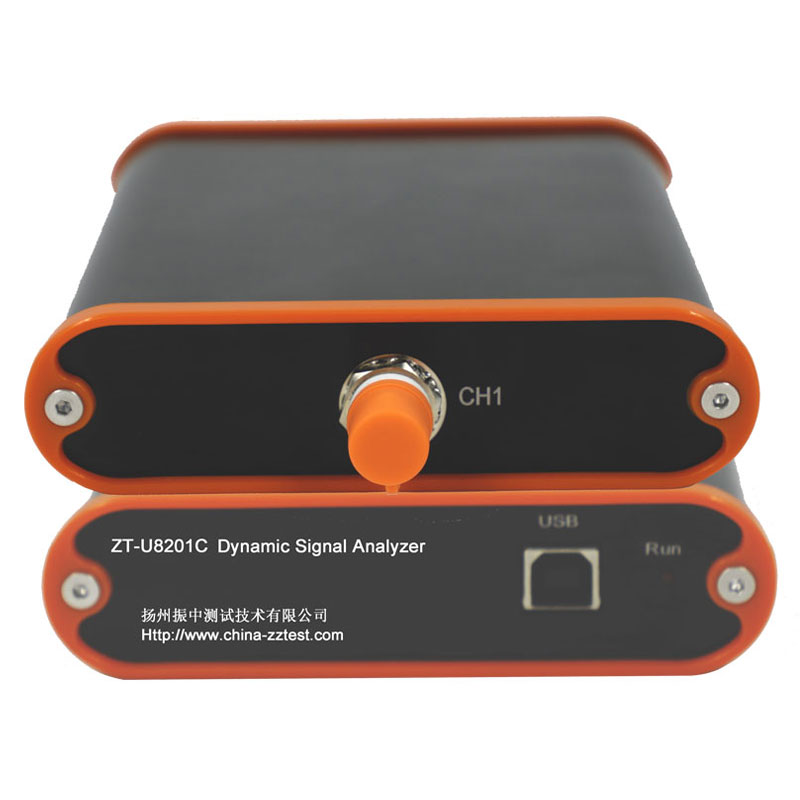
A handheld meter answers the question "how loud". It struggles with "which component, and why". Once a project needs third-octave or narrowband spectra, order analysis on rotating machinery, simultaneous noise and vibration channels, or continuous monitoring over months, the natural next step is a multi-channel dynamic signal analyzer with the appropriate transducers attached.
That step changes the workflow in useful ways. All channels share one time base, so phase relationships survive and transfer path analysis becomes possible. Data can be streamed to a network rather than carried back from site on a memory card. And the same hardware that records noise also records acceleration, force and strain, which is exactly what a modal test or a故障 investigation requires.
Networked analyzers such as our ZTN8128-family instruments are usually deployed where several measurement points must be captured together, for example a machine enclosure, a gearbox test stand or a building façade with multiple microphone positions.
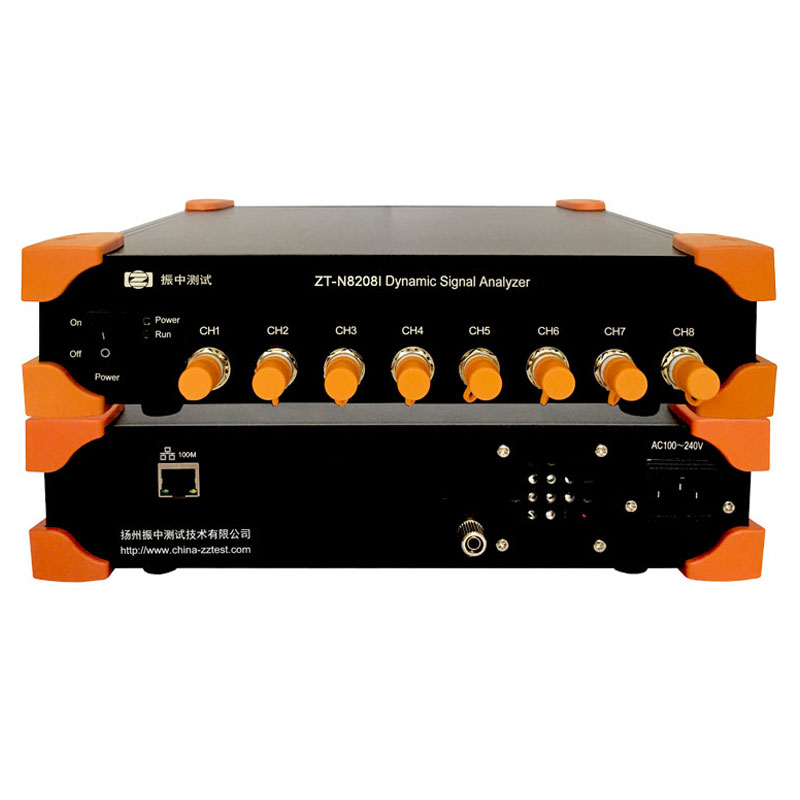 ZT-N8208I 8-Channel Voltage/IEPE Dynamic Signal AnalyzerAn eight-channel, 24-bit analyzer with 100Mbps Ethernet, IEPE excitation and 128kHz sampling for synchronised vibration and shock measurement.View Product →
If you are weighing the two approaches, our note on how a dynamic signal analyzer differs from a traditional instrument walks through the trade-offs in more detail.
The pattern across all of this is consistent. A sound level meter rewards preparation far more than it rewards features: a stated metric, a verified capsule, a sensible measurement position and a recorded calibration check will outperform a more expensive instrument used carelessly. Whether the number ends up supporting a compliance report, a design decision or a student's first experiment, it deserves the same discipline. That is the part of the work we enjoy most, and we are always glad to talk through a measurement chain before it is ordered rather than after.

 English




















 Address : No. 85, Hetao West Road, Hanjiang District, Yangzhou City, Jiangsu Province, China
 Phone: +86-0514-85764839
 Tel: +86-0514-85764839
 Email: sales@china-zztest.com
